
Quick Reports
Quick Reports can be used to download fully editable Excel tables and charts for selected questions. The quick report can be downloaded at any stage during or after the data collection period.
To set up a quick report:
- Go to the Manage Data Tab in the Control Panel, and ensure that the correct project is selected in the project drop down box at the top of the screen.
- Select the variables to include by clicking on a question in the available Questions Panel to move it to the Selected Questions panel - and vice versa to unselect.
- Once you have selected all of the variables you need, click on Save Definition. In the Enter definition details dialogue box, type in a name and description of your quick report and click OK. You can set up as many quick report definitions as you’d like for any project. To reset, clear previously selected questions by clicking on Clear All.
- Go to the My Survey tab in the Control Panel, and click on Quick Report.
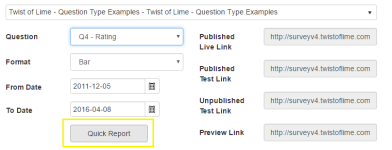
- Select the required report definition from the drop-down box and click Submit.
- The quick report will download in a zip file – simply double-click on the file to open it in Excel. The first sheet contains a table of contents for the quick report, and each of the downloaded questions appears in a separate sheet. Click on a hyperlink to navigate to a sheet to view a fully editable table and chart for each question.
